|
|||||||||||||||||||
|
|||||||||||||||||||
|
About Us Visitor
Number |
|||||||||||||||||||
|
PDF of this file Lead Climate Change Speech CONFERENCE SPEECH for CLIMATE CHANGE: HEALTH AND ENVIRONMENTAL
IMPACTS OF CHEMICALS Session: "Climate Change and
Chemicals Use: Adaptation and Mitigation Measures for Minimizing the
Emerging Environmental and Health Issues." Title: Lead Toxicity and Climate Change Authors:
Theme: Climate change abatement actions must also reduce exposure to lead, the most common industrial contaminant, or lead poisoning rates will rise globally. Objectives: To examine the tradeoffs between climate change abatement and lead management; to explore the potential to reduce greenhouse gases (GHGs) and lead use/contamination concurrently; To examine the interactions between climate change and elevated blood lead levels (EBLLs) and how global warming and climate variability modify the health impacts of EBLLs. To suggest policy and regulatory solutions that minimise these problems. Sources of data: GLASS & NRCLPI case studies, government reports on GHG (IPCC, Garnaut, Stern), lead/metal association reports, journals, newspaper articles and electronic newsletters including LEAD Action News, published by The LEAD Group (Whitton, 2009). Major findings: Efforts to mitigate climate change & lead need to be directed towards win-win scenarios Governments need to more carefully manage lead in this period of global warming Our exposure to a toxic substance that cannot yet be effectively removed from the body must be examined, in particular the increased risk of exposure to lead due in part to efforts to mitigate climate change Individuals and governments must realise our ability to prevent climate change is likely to be limited and adjustments (and investments) need to be made on a permanent basis Increased incidence of drastic weather events such as tornadoes, wildfires, floods and droughts will compromise current methods of lead waste storage and enable distribution of all lead uses/sources particularly in the form of dust Lead-related problems created by addressing climate change will include: increased lead use in storage batteries for electric bikes and vehicles and renewable energy, and seasonal raised blood lead levels in children. Gains of lead-conscious climate change policy include: removal of ceiling dust safely before installing ceiling insulation, and reducing both GHGs and lead pollution by reducing the burning of fossil fuels, by reducing greenhouse cost of transport of goods and people, and reducing the need for newly-mined lead. Why is Lead Toxicity such an important issue in Climate Change policy? There are systemic gains and losses to be had in terms of lead management from both action and inaction on climate change, as this paper will detail. See examples in the chart below. GRID of Gains & Losses GainèGain = Gain re: one issue leads to gain re: the other issue, etc. Pb mgt = lead management. GW&CV = Global Warming & Climate Variability.
[Slide 1 Intro] This is a paper on the impact of global warming and associated increased climate variability on a particular toxic chemical: lead. Because lead replaces iron and calcium within the body and its capacity for treatment is limited by the fact that it is mostly stored inside bones this is a paper about exposure rather than treatment or health impacts of temperature increases on lead affected individuals. [Slide 2 Simplified corrected Matrix] [Slide 3 Climate Change] But first to describe the scope of the problem posed by global warming. The IPCC has estimated that global temperatures may rise by between 1.1 and 6.4 degrees (from a baseline of 1960-1990) sometime during the 21st century. The general scientific consensus that emerged in forums like the Bali conference is that for there to be an around chance of limiting the rise of global temperature to a 2°C increase (current gain 0.6°C) since industrialization, we would need to reduce greenhouse gas emissions in developed countries by 25-40% by 2020 and total global emissions by 50% of 1990 levels by 2050. Global emissions would have to peak by 2015. The problem is, these goals are unlikely to be achieved and even if they were, may be inadequate to limit [Slide 4] There is no indication that even the recommended Bali cuts will be achieved on a worldwide basis. The Kyoto protocol resulted in no significant reduction in the rate of carbon dioxide or nitrous oxide growth in the atmosphere. China and India have rejected absolute cuts while America has offered a conditional 17% (<16% including agriculture). Without these three who represent 40% of carbon emission now, over 50% in 2030 and > 85% of increases in coal fired power by 2030 required cuts cannot be achieved. Should greenhouse emissions peak at or after 2020 an effective Kyoto scale cut would be required every year to reach the 2050 targets. Failure to reach either 2015 or 2050 targets would almost lock in a 3°C rise. Cutting emissions after 2050 would reduce greenhouse gas increases but not remove greenhouse gasses already in the atmosphere especially as carbon sinks appear to be shrinking (more then 10% over the last 50 years).Looking at a chart form the Stern review this would mean declining crop yields, aridity, food shortage notably in Africa & W. Asia, a 30% run-off decline Mediterranean and S. Africa due to aridity, decline of the Amazon rainforest due to extended dry seasons and a doubling of the cost of hurricanes in the USA. Lenton provides a rare bright spot by pointing to possible greening of the Sahel/Sahara at these temperatures at the cost of the west African monsoon, boreal forest dieback and greater El Nino intensity. This it the maximum target of the Stern and Garnaut reviews (and the outcome both believed achievable) and a probable medium term (20-40 year) outcome of current global policy settings assuming the dominant scientific models are correct. While such models could prove incorrect they may understate as well as overstate the problem as the arctic may demonstrate. The ability to stabilize temperatures at this level assumes that no significant increase in natural emissions, reductions in carbon sinks or temperature impacts from non-greenhouse gas effects while the warming is occurring. The artic, Amazon rainforest and boreal forest are all carbon sinks with the arctic having stored more than terrestrial tropical and temperate zones combined: twice the amount in the atmosphere. Increases in artic methane emissions alone is likely to equal more than 6% of yearly global anthropogenic greenhouse emissions while 3,600 times this much may be frozen in permafrost. The current policy settings give cause for concern. The assumption that these cuts on this scale could halt climate change at or below 2°C rather than ameliorate the rate of rise in temperature is based on three assumptions: that the warming we are presently experiencing is the full effect of warming to date, that all greenhouse gas emitters have similar impacts and that variable regional impacts will not trigger feedback loops that negate reductions in anthropogenic greenhouse impacts. Work by individuals and teams like Ramanathan & Feng appear to have negated the first two points. Firstly we may have only experienced one quarter of the implied climate change. The real temperature increase could be 2.4 degrees since industrialization but the planet been protected by the atmospheric pollution we emit. We may be beyond the two degree horizon and a reduction of 70% of all anthropogenic emissions would see a full 2% increase even if we emitted no more greenhouse gasses. Second, not all greenhouse gas emitters have equal impact. While coal fired power stations turn out massive amounts of carbon dioxide most also produce emissions such as SO2 which can completely negate its short-term greenhouse effect. Cutting emissions from most coal fired power stations (16% of global emissions) or sea transport (1.7%) would have no immediate impact and so can not be counted in emissions reduction in the short term. Almost all current greenhouse schemes exclude agricultural production (14% of greenhouse emissions) since emissions difficult to measure or techniques to modify them are uncertain. Thus the real cuts required are approximately 36-57% for developed countries in over just 11 years and over 70% of all global greenhouse emissions {excluding sectors listed above by 2050, without any certainty this will be adequate. We need to get used to living on a warmer planet with more frequent extremes. [Slide 5] Climate modelling is an inexact science and specific predictions must be treated with caution. However current modelling tends to agree on some broad trends. The most important are increased climatic variability (including increased risk of hurricanes, typhoons, floods, droughts and associated phenomena such as avalanches, mudslides and dust storms) and changes in precipitation and evaporation. There is strong evidence that these effects have already been occurring in the past two decades. The accompanying slide shows key projections of which areas will experience increasingly strong precipitation [Pause or read] and aridity [pause or read]. A projected doubling of hurricane damage in the USA as temperatures move past the 3°C mark is likely to have significant implications for containment of any number of toxic chemicals. There is also strong evidence that much modelling underestimates the variability in precipitation and that if precipitation occurs in short intense bursts a climate can become more arid even as rainfall and flooding increase. On current projections southern and western Australia, the south-western USA, and the northern Mediterranean will suffer both from increased aridity and increasing intense precipitation events. Mine tailings in these regions will be extremely vulnerable to release by flash flood and once released easily distributed by dust storms so measures need to be taken to reduce that vulnerability. An area where this may be of particular note is central Asia where increasingly arid lowlands have rivers that are fed from Asian mountains that may experience increasingly intense precipitation events and disappearance of glaciers leading to intensified seasonal flooding. In addition efforts to ameliorate climate change through reduced carbon combustion will change the quantities of lead available to be released into the environment. Both increased waste dispersion and amelioration of greenhouse gas emissions have significant implications for the management of lead waste. [Slide 6] Lead is a common pollutant whose abundance is likely to increase as efforts to reduce greenhouse gas emissions increase. Lead (or other heavy metals) feature in all but one (Dzerzhinsk) of the Blacksmith Institute’s “World's Most Polluted Places”: 1. Linfen, 2. Tianying, China. 3. Sukinda, India. 4. Vapi, India. 5. La Oroya, Peru. 6. Dzerzhinsk, Russia. 7. Norilsk, Russia. 8. Chernobyl, Ukraine. 9. Sumgayit, Azerbaijan. 10. Kabwe, Zambia. With lead mine production increasing annually, the amount of lead “out there” (variously dispersed into the environment or still in use), or “cumulative lead mine production” now well exceeds 300 million metric tons all of which needs to be managed in perpetuity.
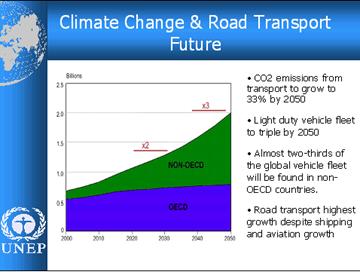
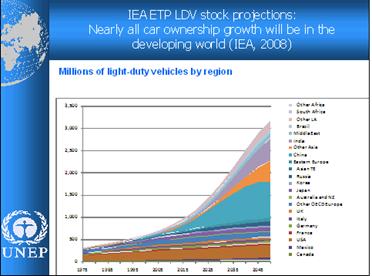
Source of data: ABARE 2008, graphed by The LEAD Group. Source: NRC, 1993, p21 [Slide 7] Lead is a metal for which the body has no use, yet lead can replace essential minerals (predominantly iron and calcium) in organisms. Even tiny amounts have significant neurological and cardiovascular effects and large quantities are fatal. Lead kills brain cells directly through apoptosis (programmed cell death) and replaces calcium in the nervous system and brain. High lead levels in expectant mothers have been linked to schizophrenia in their offspring. Lead has toxic impacts on the kidneys and liver. It produces anaemia by preventing the formation of haemoglobin inside red blood cells eviscerating the blood’s ability to carry oxygen. Children are particularly vulnerable being more likely to ingest lead through normal hand-to-mouth activity, more able to absorb lead through ingestion and less able to handle its impact on still developing body systems, particularly the brain. Lead can be absorbed either through ingestion or (more efficiently) through inhalation, and to a lesser extent via skin absorption, especially when the skin is sweaty. Blood levels above 10 µg/dL (micrograms per decilitre) were seen as a cause for concern by the World Health Organisation (WHO) in 1992, but there may be significant health impacts even below this level and a number of scientific reviews have suggested lowering this threshold by at least half and even as low as 2 µg/dL to prevent IQ loss and early death. The phasing out of lead petrol in most countries has seen a consistent worldwide fall in average blood lead levels but more than a dozen countries have yet to phase out leaded petrol and the lead deposited by petrol combustion in fine particulate dust over decades, remains a cause for concern even where leaded petrol has been phased out. Japan, the first country to phase out leaded petrol, has average blood lead levels under 4ug/dL and now receives much of its airborne lead pollution from continental Asia. The situation is much worse in large portions of the third world. In Karachi, Pakistan as recently as 2002, 80.5% of children had blood lead levels of more than 10 µg/dL. In a meta-analysis by Wang and Zhang (2004), more than one third (33%) of the children in China were found to have blood lead levels greater than 10 μg/dL. In an Indian survey of 2,031 children and adults in 5 cities, more than half (50%) of them had blood lead levels greater than 10 μg/dL (George Foundation, 1997-1998). Recent reductions in Indian blood lead levels have still left the children of five cities with average blood lead levels of 12.1 µg/dL (Singh & Singh 2005). Lead poisoning is thus, extremely common. Unlike with the costs of reducing climate change, the costs of reducing blood lead levels have been shown to lead to huge economic benefits. In the US, Grosse et al (2002) compared children of the late 1970s to children of the late 1990s and estimated that the latter’s lowered blood lead levels and consequent raised IQ and lifelong earnings create an economic benefit for each year’s cohort of 3.8 million 2-year-old children, ranging from $110 billion to $319 billion (US year-2000 dollars). Gould (2009) demonstrated that for every (US) dollar spent on controlling lead paint hazards, between $17 and $221 is returned in benefits to society, not only in increased earnings and tax revenue, but also in reduced costs of healthcare, special education, attention deficit–hyperactivity disorder and crime. Losses or gains in global warming and climate variability lead to respective losses or gains in lead management. [GW&CV GainèGain Pb mgt 1 of the GRID] [GW&CV LossèLoss Pb mgt – Quadrant 4 of the GRID] [Slide 8] The direct impacts of human activities that decrease / increase atmospheric carbon can also decrease / increase lead exposure. Although the growth in human population has had a significant impact on climate change, the rate of growth of the vehicle population has been even faster, and projections are that the number of vehicles is set to triple to two billion by 2050 with CO2 emissions from transport set to grow to 33% of all anthropomorphic emissions by 2050. More recent projections put the car population as high as three billion by 2050, with nearly all car ownership growth expected to be in the developing world. Every car requires a new battery every 3-5 years throughout its life.
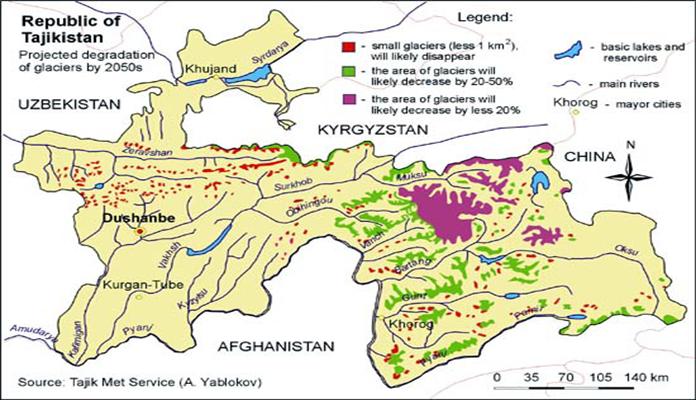
Source: de Jong, Rob, United Nations Environment Program (UNEP) Since almost all combustible material contains trace elements of lead there is a strong likelihood that exposure to atmospheric lead may increase even in regions that have phased out leaded petrol. In Brazil it was estimated that increased coal burning between 2002 and 2006 would increase atmospheric lead released by this sector from 23.3 to 29.9 tons (Vaisman & Lacerda 2003). [Slide 10] Increased regional aridity can also significantly increase human exposure to lead. Laidlaw and Filippelli (2008) have recently demonstrated that in US cities greater than 50% of the seasonal changes in blood lead levels of children (who are particularly vulnerable to lead’s neurological impacts) can be predicted from weather patterns. Over 50% of such variations can be explained by monthly soil moisture, PM10 (fine particulate pollution), wind speed and temperature. In situations where ambient moisture is low, soil (particularly the finer grained soil most likely to be contaminated by gasoline lead in the past 90 years) becomes resuspended in the atmosphere, making up over 50% of fine particle pollution. Soil re-suspension can contribute over 40% (and as much as 75%) of atmospheric lead content after leaded gasoline has been phased out. One of the least-known “sinks” for lead air pollution is building cavity dust which accumulates (often from decades of air pollution fallout) especially in the ceiling void and sits on top of the ceiling until events such as hail storms or heavy snowfall damage the roof and ceiling and allow the dust to get into the living/working space. Over half of the lead in house dust may be from external sources and three quarters of the dust in ceiling voids may be soil or plant matter. [Slide 11]The level of lead in the air falls markedly once leaded petrol is no longer in use, so it is of some concern that central Asian countries which are already dry and dusty continue to use leaded petrol. Leaded petrol is still legal in Tajikistan and Uzbekistan and may be available in neighbouring countries. While rainfall projections in this region are uncertain as the globe warms (at least significant ongoing aridity can be expected so a clear priority is to complete the global elimination of leaded petrol. Unfortunately, this region is also heavily polluted with lead from Soviet era enterprises with the Ferghana Valley (shared by Uzbekistan, Tajikistan, and Kyrgistan) being a good example. Case study: The Ferghana Valley is home to over 8 million people including 27% of Uzbekistan’s population even though it represents 4.3% of its area. The Adrasman lead-silver ore extraction site in Tajikistan and enrichment plant in northern Tajikistan contains an estimated 18,000 tons of lead waste in tailings. The region is already seismically unstable and prone to flash floods. There was already a major contamination event in 2005 exposing lead waste to direct run off. There was also a lead treatment facility in the Sumsar Valley. An ENVSEC governmental environment meeting in Dushanbe was informed that the waste from this site was unowned, unmonitored and allowed to wash away during downpours. The waste tailings are located near the banks of the Sumsar River near residential areas that use the river for drinking water. There is no record of any follow-up action If rainfall events become more intense as global models predict, the risk to such deposits intensify, so efforts must be made to store the lead waste in a more manageable form. The combination of glacier-fed rivers with heavy mountain precipitation (for the moment falling as snow) leading to seasonal flooding combined with an arid, dusty lowlands offers a “perfect storm scenario” for the distribution of a toxic substance like lead in a period of global warming. The following maps indicate the scale of vulnerability. Projected degradation of glaciers by 2050
Source: Tajikistan 2002: State of the Environment Report UNEP, 2003 Industrial pollution and waste hotspots in the Ferghana Valley
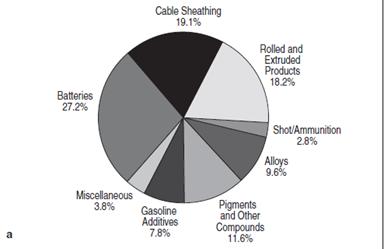
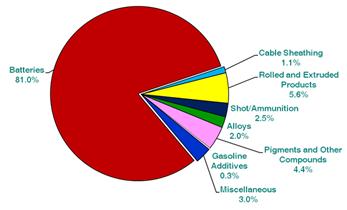
Source: UNEP April 2005 from Ferghana Valley Environmental Media Tour 5 - 10 June 2005” Regional precipitation may increase the distribution of lead contamination both in volume and the area affected. Unfortunately while this aspect is of key importance it is also technically complicated as it relates to waste storage and its management and contaminant dispersal. The fact that lead’s ability to pass into water can vary over 10 times depending on the compound it has formed, the surrounding chemistry and acidity make this a specialised field. Lead is certainly less soluble in alkaline conditions and any increased carbon content in the water will make the water more acidic. The overall impact of increased global warming on blood lead levels (if tertiary lead poisoning prevention treatments are not researched and developed) will be a severe loss for all those affected. [GW&CV LossèGain Pb mgt – Quadrant 3 of the GRID] On the positive side n some circumstances more droughts will mean there will be less water-borne lead contamination from flooding (but more air lead pollution and less water available for hygiene and cleaning so this is an arguable gain). [GW&CV GainèLoss Pb mgt – Quadrant 2 of the GRID] [Slide 12] Measures to limit global warming also present severe challenges to lead policy and management. At the present time, lead acid batteries are the predominant form of energy storage with lead acid batteries making up the bulk of installed capacity for the car and small scale static use (such as home-based wind or solar) though exact figures are elusive partially due to battery reuse eg. using car batteries for home storage as in Uganda. The following charts showing global lead use in 1960 compared to 2008 and growth of lead use in lead-acid batteries gives a good idea of the scale of the problem. The End Uses of Lead 1960 The End Uses of Lead 2008
Source of 1960 piegraph: Wilson, 2006. Lead For Batteries 1990-2008 Use
Source of coloured charts: Wilson and ILA, 2009 Addressing climate change is not always a win-win proposition. Acting against climate change can increase the amount of lead in circulation. It is necessary to understand the relationships between diverse and complex systems before creating policy initiatives. Coupled with the lack of occupational health and safety or environmental safety regulations and enforcement, a major problem with more lead acid batteries in circulation is that they are readily turned into lead bullets or shot, fishing sinkers, jewellery, craftworks, lead arsenate pesticide, etc. Globally, more than 375,000 people are killed each year by small arms:- how many of these weapons are using ammunition made out of black market lead? The abundance of black market lead (lead that enters a country as a battery or computer or TV CRT but is not collected for large-scale regulated lead recycling) also encourages an increase in illegal or insane uses of lead, such as the addition of lead to cosmetics and Ayurvedic or other folk medicines, to illegal drugs such as marijuana or opium, spices or other foods either to colour the product or to increase its weight. For instance, one study from India indicates that over 99% of local turmeric may be lead contaminated possibly due to colouring agents (Girimaji 2004). Moharari et al (2009) reported that an Iranian father and son added lead to the opium they sold (to increase the weight and make more profit) and actually used the lead-dosed opium themselves. They were both hospitalised for severe lead poisoning, during which the father died. Grid based energy production – Lead from coal, natural gas and biomass [GW&CV LossèLoss Pb mgt – Quadrant 4 of the GRID] [Slide 13] One of the most widely reported greenhouse gas contributors is coal. Since the phasing out of lead petrol in most industrialised countries, coal-based power production has been a significant contributor to atmospheric lead pollution. Coal produced 12% of atmospheric lead emissions in the European Union in 2004. Spectrographic analysis of particulates in Shanghai indicated that up to 45% of lead may come from coal burning, and may well have exceeded petrol as a source if not for the phasing out of leaded petrol. In addition to airborne emissions, there is also significant lead in fly ash waste product stored in waste ponds. There have been two major US fly ash spills from storage ponds recorded in the past decade: Martin County in October 2000 (released 1.16 billion litres of waste) and the Kingston Fossil Plant (released 4.2 billion cubic meters) in December 2008. However, coal-fired power production produces significant SO2 and brown cloud pollution, which can offset the warming caused by its greenhouse gas content reflecting heat from sunlight into space. Thus, coal fired power production may have no effect on global warming except in jurisdictions that have significantly reduced its SO2 emissions, eg in OECD countries, particularly in Europe. Natural gas is a cleaner energy source than coal, producing about 60% less carbon dioxide emissions per unit of energy, and about 80% less nitrous oxide emissions and contains minimal lead concentrations. A possible downside is the impact of fugitive methane emissions from natural gas production and storage, which for Canada amounted to 8% of all carbon emissions in 2007 (equivalent to about 33% of the emissions of the transport sector). It also produces almost no SO2 to offset its atmospheric carbon impact so its global warming impact may be considerably higher than coal. Oil-fired power produces 80% of coal’s CO2 emissions and considerable SO2 but also considerable black carbon. Whether it is better or worse than gas for global warming purposes depends on the estimation of the impact of black carbon. It certainly can produce significant lead emissions with burning of a specific heavy oil fraction producing 17.9% of industrial lead emissions in Cairo in 1999. Biomass combustion is an emerging technology that has received significant interest from governments. The most widespread example is the use of ethanol in cars but preliminary research has been done on using it in conjunction with or instead of coal or petroleum products for base load power. Traditionally most biomass is used in household furnaces and in appliances up to 5 MW. The widespread use of biomass combustion inside houses for cooking and heating in the third world is not only a significant CO2 source but produces a range of pollutants. Biomass combustion can be more polluting than fossilised carbon, though its trace heavy metal content can vary widely. In Northern Ireland, biomass and coal combustion produced most of the 42% of lead emissions from domestic sources. Home-based biomass or coal combustion is the primary source of antropogenic black carbon pollution (<50%). Home or industry based coal combustion produces black carbon (soot) because the black carbon is a product of incomplete combustion at lower temperatures, a factor that does not apply at power stations. Black carbon warms the atmosphere and is responsible for snow and ice melting due to changed albedo (reflectivity of sunlight and heat) and temperature at altitude but reduces temperatures at sea level. Claims for a major role in the retreat of arctic sea ice need to be balanced with the role of thermohaline ocean currents which move warmer water from the Atlantic to the arctic and changing albedo due to ice loss and plant growth.. [GW&CV GainèLoss Pb mgt – Quadrant 2 of the GRID] [Slide 14] There are over two dozen types of nuclear reactors now operating. But regardless of type they contribute less greenhouse gas emissions per watt of output (including manufacturing, construction, maintenance and running related emissions) than any of the alternative energy sources: 70% of the greenhouse gas cost of wind and as low as 25% greenhouse gas cost of solar. The problems are fuel security, toxic waste, plant security, meltdowns and risk management. The new types of reactors, building on the lessons of the past, will reduce waste production and risk. However, one new type of reactor is lead-bismuth cooled, which should of course be discouraged and avoided. During the world’s worst environmental disaster, the Chernobyl meltdown, from 27 April to 5 May 1986, more than 30 military helicopters flew over the burning reactor in a failed attempt to smother the fire with 2,400 tonnes of lead and 1,800 tonnes of sand. (Chernobyl.info, undated). Greenpeace (p67, 2006) reports that compared to 1985, anaemia rates in some local regions increased 7-fold during the first 3 years after the accident, apparently correlated to the level of radioactive contamination, however, lead pollution may have been a confounding factor in the study. Hydroelectric power probably has insignificant impact on lead emissions or waste (though it can increase lead levels in sediments behind the dam) but a variable impact on greenhouse gasses. Major hydroelectric schemes are able to produce significant methane. The electricity produced in tropical regions thereby releases more than twice the greenhouse gases produced by oil combustion, compared with as little as 2% in boreal regions. Tropical conditions are set to expand as the temperature warms. Geothermal energy has almost no greenhouse impact beyond construction, and its lead impact is limited to the risk of leaks of lead contaminated steam. While it produced 0.4 % of the world’s energy in 2004 (EIA, 2007), it is geographically restricted requiring suitable locations and is not projected to grow much in the next 21 years (EIA, 2009). The primary lead impact of solar, wind and similar alternative power is storage to deal with the variability of electricity production where inadequate immediate grid demand exists or where there is no reliable grid connection (ie. local or household electricity production or backup). Their efficiency in reducing greenhouse emissions in an electricity gird is reduced by the need to co-generate a proportion of the electricity from other sources in case of changes in output. The degree to which they can contribute to our energy future is the subject of fierce debate frequently with doubtful scholarship. In addition solar panels use powerful greenhouse trace gasses in their production notably nitrogen triflouride, a substance with an estimated 17,000 times the greenhouse impact of carbon dioxide. The lead waste generated by electricity storage can be considerable where lead acid-batteries are the most convenient form of storage. The ILA estimate 15% of new lead acid batteries, containing 1,100 tons of lead, were used in static roles with this proportion likely to grow. Each computer distributed in the developing world can add 0.9-1.6 kg of lead waste to the environment, due to the unreliability or absence of mains power supply and this is from a single appliance. In the United States lead acid batteries generate over 1.8 pounds (0.8 kg) of lead waste per person. However, little enters the waste stream as 99.2% of lead-acid batteries are recycled. This is not true of many developing counties. In Uganda in 2000 for example, less than 10% of batteries used for solar systems were returned to the distributor, located in the capital of a country with limited transport and lacking the capacity to reprocess more batteries even if they had been returned. The competitiveness of lead-based electronic storage in an industry where (unlike transport) battery size and weight is not a major concern is likely to be given a massive boost by the development of lead-carbon batteries that can use the same recycling technology as lead-acid batteries. Preliminary tests of some commercial designs indicate they compete comfortably with Lithium-ion technology for performance, and are likely to be considerably cheaper. Venture capital companies (US military backed) are developing and have already commercially released a foam-based alternative (3D, 3D2) to enhance lead acid battery performance, with claims of improved size/weight ratios for transport applications. What are the biggest emitter countries doing about their greenhouse gas emissions? Energy for transport – Lead exposure from petrol, gas and electric cars Losses in lead management lead to gains in global warming and climate variability. [Pb mgt LossèGain GW&CV - Quadrant 3 of the GRID] [Slide 14] Transport contributes 14 % of global carbon emissions. 45% of this is generated by cars or vans used predominantly for personal transportation. Transport is projected to be the second fastest growing carbon emission sector. Hydrocarbon-powered vehicles have the largest impact on global warming of any element of transportation and one that grows over time. For many years leaded petrol provided the primary atmospheric lead pollutant. A significant but declining number of countries continue to use leaded gasoline. The use of leaded petrol prevents the use of catalytic converters which reduce the presence of tropospheric ozone, the second most significant greenhouse gas produced by road transport. Unfortunately this is not the only consideration as even three way catalytic converters produce NO2, doubling transport emissions of NO2 from 1990 to 2006. They also produce the toxic substance hydrogen sulphide (reducing sulphur dioxide production) and ammonia (which can be a nitrous oxide precursor). Both the greenhouse and toxic gas impact of catalytic converters may be marginal at best. Unleaded hydrocarbon fuels and brake pads still provide a small proportion of atmospheric lead emissions: an estimated 5-8 % of lead emissions in the EU. UK figures vary from 1% in Wales to 9%. Hydrocarbon-powered vehicles are divided by their fuel source (petrol, diesel or gas). Petrol-driven cars aren’t as fuel efficient as diesels or as clean as gas-powered ones. They produce little black carbon (<2% of global emissions) Diesels have the bulk of the vehicle market in Europe and major shares of the heavy vehicle market in Australia and America. Diesel engines are 30-50% more fuel efficient than petrol engines, produce less CO2 but far more particulate matter. In spite of having less than 3% of new car and light vehicle sales and 56% of one ton trucks in the US, diesels produced 67% of black carbon emissions in Pittsberg in 2006. Over 19% of black carbon emissions come from the transport sector, almost all from diesel or two stroke engines. Gas powered vehicles have the reputation for reasonably clean burning. Tests carried out earlier this decade found that light vehicles powered by gas rather than gasoline, achieved significant emission reductions while emitting little trace or particulate pollution: CO 90% reduction, CO2 20%, NO >35%, Hydrocarbons >50%. Comparable statistics for heavy vehicles were halved particulate production, CO2>25% reduction, NO and hydrocarbons >50%, at the cost of increased methane production (US DOE). This means vehicle gas combustion still produces significant quantities of greenhouse gases though it is the hydrocarbon least likely to contain naturally-occurring metal trace elements such as lead. The extent to which electrical vehicles contribute to greenhouse warming is largely dependent on the source of the power they charge on. In terms of raw efficiency, there is not a lot to choose between an electric or petrol driven car. To date, price, range restrictions and limited refuelling options away from base, appear to be the greatest impediments to uptake. Hybrid vehicles are proving more popular but lead-acid batteries face significant competition from alternate battery technology with both hybrid and electric car markets and to date little lead has been used in these markets. The major niche for lead-acid batteries seems to have been the electric bicycle/ tricycle market in Asia particularly China. Using cheap lead-acid batteries they provide convenience in congested cityscapes. According to the ILA (International Lead Association) >7% of current lead used in batteries is used in Chinese electric bicycles/tricycles and this is likely to grow. Batteries used to power electric vehicles have shorter lives than those used as ignition batteries due to the number of recharges they undergo, and must be replaced more frequently. The main problem is that in 2006 only 31% of batteries were recycled in China. An equal number were believed to be recycled through a battery black market with poor control and safety standards. Given that even the official recycling lost 30% of recycled lead to the environment, Cherry estimated each 10 Kilo battery produced 6.9 kilos of lead waste, so of the 700,000 tonnes of lead used in electric bikes last year, as much as 483,000 tonnes may have escaped into the environment. Clearly, this rate of loss is alarming. Rural contributions to climate change and lead levels [GW&CV LossèLoss Pb mgt – Quadrant 4 of the GRID] Rural industries contribute three major greenhouse gasses to the atmosphere: carbon dioxide, methane and nitrous oxide. CO2 is predominantly created by the burning of forested areas for farmland, providing about 18% of global carbon emission. Larson & Koenig reported that lead particles in wood smoke ranged from 0.1 to 3.0 mg per kg of wood burned. Burning 3 tonnes of wood, will therefore result in between 0.3 and 9 g of lead emissions. Methane is produced by livestock and rice cultivation. Nitrous oxide is produced by bacteria from manure and fertilizer and nitrates transferred to the oceans where more nitrous oxide is produced. Apart from wood-burning therefore, the primary lead impact in non-lead-mining or smelting rural areas is increased exposure to lead from flooding and desertification. The vexed question of coal-fired power and nuclear power plants [Pb mgt GainèLoss GW&CV – Quadrant 2 of the GRID] [GW&CV LossèLoss Pb mgt – Quadrant 4 of the GRID] Tranformations are being attempted. Europe, the fourth largest producer has targeted 20% of energy (twice its current proportion) from renewable sources by 2020 at significant cost, yet this will not reduce its absolute carbon consumption. It is replacing a proportion of its coal fired power with greater gas fired production possibly reducing emissions while its greenhouse impact increases. The region has substantial diversity in power generation including nuclear and wind power yet it still uses carbon combustion (including biomass) as its primary electricity generator at 55.1% in 2006.
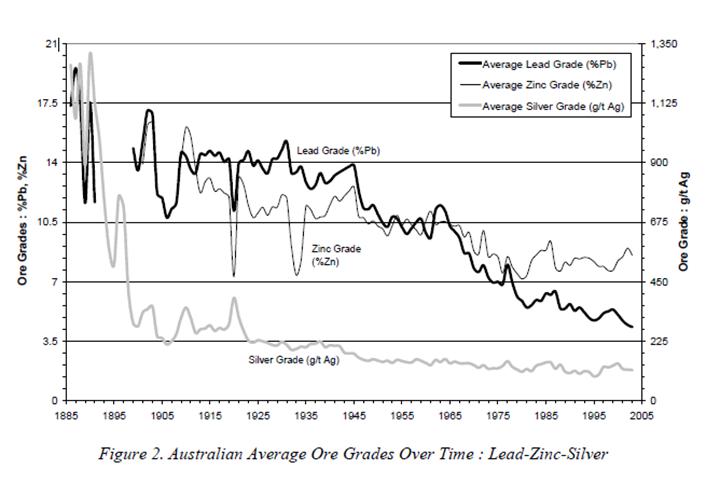
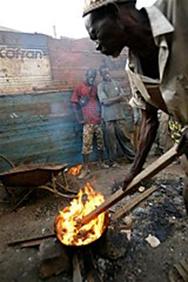
The consequences of increased demand for lead [GW&CV GainèLoss Pb mgt – Quadrant 2 of the GRID] The danger is that if lead prices rise there will be more incidences like Thiaroye Sur Mer, Senegal where 18 children died and an entire town was lead poisoned. A lead merchant offered the townspeople 60 cents a kilo for lead sifted from a blacksmithing site where batteries had been turned into sinkers for fishing nets, lead poisoning all who took part, and through releasing dust with high lead concentrations into the air, the entire town (Vogt, 2009). Source: AP Photo/Rebecca Blackwell Some calculations have less than 22 years global supply of lead remaining which could be profitably mined at current prices (Garnault, 2008 p71) and prices and volumes are bound to rise as carbon reduction strategies take effect, increasing the demand for lead acid batteries. Over time and as the price of lead rises, higher tonnages of lower-grade ores are mined, thus increasing the tonnage of waste per tonne of lead or zinc mined. From the following graph, there is currently approximately 4% of lead and 8.5% of zinc being extracted from each tonne of lead-zinc-silver ore in Australia (the world’s biggest lead exporter), presumably leaving approximately 87.5% waste rock, though the actual tonnage of mine waste per tonne of newly mined lead is around 29 tonnes of lead for an underground mine and 87 tonne for an open pit, th. Lead and zinc smelting produces 9.3-9.6 kg waste per Kg of lead
Source: Mudd, 2005 “Accounting for Increasing Mine Wastes in the Australian Mining Industry.” Conclusions The primary goal of climate change policy is to significantly reduce overall greenhouse impacts by 2020 since if effective greenhouse emission levels (counting offsets such as SO2 emissions) continue to rise after 2015 only global scale carbon sequestration can limit temperature rises to 2-3°C even without arctic feedbacks A billion people being short of water should temperatures increase by 4° C and an equal number living with much higher, more intense precipitation would pose an unprecedented challenges for lead management. Black carbon should be given a degree of priority as its atmospheric life is measured in week rather than years and directly impacts the shrinkage of ice worldwide. The primary goal of lead policy is to limit individual exposure to lead. These policies are not antagonistic but nor are they synonymous. A number of greenhouse emissions policies would have positive feedbacks for lead management including moderating the pace of precipitation changes. Few lead policies have significant impacts on global warming Recommendations Gains in global warming and climate variability lead to gains in lead management lead to. [GW&CV GainèGain Pb mgt – Quadrant 1 of the GRID] For both and developing developed countries the primary policy could be immediate hefty increases in taxes on hydrocarbons for transport and the immediate cessation of direct and indirect government hydrocarbon subsidies current in many countries. In spite of the fact that fuel is relatively cost insensitive, unlike major power generation and other transport modes, vehicle technology and usage can radically shift in a 6-11 year lifecycle. Fuel use in the USA (responsible for 37% of transport emissions) fell in 2008 due to a combination of high fuel prices and the economic recession. It should be accompanied by an abandonment of subsidies and mandates for most biofuels, especially given most biofuels increase global warming by forest clearing in the developing world or increasing nitrogen oxide release from farming. Diesel standards should also be raised as diesel vehicles produce over 10% of global black carbon emissions. Reduction in fuel use would directly reduce lead emissions. An additional goal is the complete the global elimination of leaded petrol. This should be achievable as only one global petrochemical manufacturer is now supplying the world’s lead–petrol additive. From the developing word perspective the priority should be reducing forest clearing as not only does it produce ~18% of greenhouse gas emissions but over 5% of black carbon emissions. Again some decline in lead emissions would ensue, though difficult to quantify. Priority must also be given to replacing or modifying biomass and coal combustion from home cooking or heating in the developing world since this produces over 50% of black carbon emissions and exposes individuals to arrange of trace metals including lead. Programmes such as Respire which aims to improve stove construction or project Surya which replaces biomass with solar or gas with must be expanded and better funded. Adding thermal insulation to a building will reduce the need for energy for both heating and cooling but when ceiling insulation is going to be installed, ceiling dust should be removed first, and recycled for its lead content (O’Brien and Roberts, 2009b). Industry is comparatively price sensitive (Stern 2007) and produces a significant amount of black carbon (about 8%, mostly from iron and steel production). Price incentives should be based on the need to rapidly reduce black carbon emissions and carbon emissions with little ancillary atmospheric pollution. While removing ancillary pollution may have positive health impacts, from some pollutants (notably SO2) the price of their elimination will be accelerated climate change. Lead impacts would vary. Oil fired power should be phased out as it adds significantly to greenhouse warming and lead polution. However this is not a priority as major power projects have long lead times and 6-11 years would not see the replacement of a major portion of generating capacity. The reduction of coal fired power will not have short term impacts on greenhouse warming. Given the unwillingness of the three dominant emitters to make adequate emission reductions, the ability to sequester greenhouse gasses may become more important in the longer term particularly if pollution levels are reduced for health reasons. Burying carbon dioxide (geosequestration) has been an attractive proposition for politicians but 13 years after it was first used and 6 years after the Bush administration pledged enormous funds to Futuregen it has produced the pilot Mountaineer project which removes less than 4% of carbon dioxide emissions from the power complex to which it is attached. Equally importantly clean coal technology is unlikely to be available on a commercial scale till well after 2020. The cost, scale, capital intensiveness and risks make it unlikely to be effective except as a political chimera. Biosequestration may well be more attractive since it is not capital intensive, can be initially implemented on a small scale and can therefore be trialled in a number of forms with different tie-ins. It is also more immediate. The idea of using algae to purify power station emissions and then to use the algae for biofuel or feedstock for animals or fish is at the point of trial commercial application and early results show some promise though it must be emphasised that current carbon reductions seem modest, especially if most of its product is burned as biofuel.. Specifically designed greenhouse gas storage mechanisms (such as biochar) are in development and may have subsidiary benefits for wider applications for control of toxics. The fact that one biochar product may be able to absorb lead is promising. Gain in lead management is neutral to global warming and climate variability. [Central Box Pb mgt GainèNeutral GW&CV] One of the most important recommendations is the need to modify the way we handle waste that contains significant quantities of lead. Mining or smelting operations traditionally use ponds or dry tailings. Such stores will be vulnerable to increasing heavy precipitation events predicted worldwide. It is vital we develop cheap ways of extracting toxics such as lead from wastes and storing them in more compact and controllable form. Current experiments with biological wastes like pectin or brewer’s yeast need to be expanded and better resourced. Chemical treatments to make lead less mobile or bioavailable also need industry and government support. We need to reduce the amount of lead entering the environment through mining, smelting, manufacturing into dispersed products, and during recycling, particularly due to the growing demand for lead acid batteries. The USA shows this is possible, where over 80% of lead is used in batteries (Shoenung, 2003) but only 0.8% of this is not delivered for recycling (Miller, 2009). While this may not be wholly achieved in the third world, a number of Indian initiatives show that matters can be significantly improved. A government tax on newly-mined lead and mandatory deposit or re-purchase schemes on lead acid batteries can be implemented through those organisations that distribute lead-acid batteries, and through certification of recycling facilities. The initiative in India was developed jointly by Occupational Knowledge International (OK Intl), Development Alternative (DA), NRCLPI and other stakeholders such as a major battery manufacturing unit and various Governmental bodies. It succeeded in the outcome of Better Environmental Sustainability Targets (BEST), which received global recognition at the recent UNEP meeting in Bangkok. It is also essential that governments enforce any regulations that they have against the use of lead (usually taken from the lead acid battery black-market) for potentially fatal uses such as in food, cosmetics, toys, jewellery, fishing sinkers, folk medicines and illegal drugs. Good case examples need to be promoted in other countries. In India, a couple of major players in battery manufacturing units have already signed up for the certification program where eco labelling of their batteries will be made available. This has already resulted in the reduced impact of lead on the environment. The average blood lead levels have come down amongst their employees. Small battery manufacturing units have signed up for improving the safety of their production of lead acid batteries. This initiative is recommended by QCI. The aspects most likely to be addressed first by governments are those that involve minimal change and minimal expenditure. The cheapest policy option is arguably education. The experience of the USA and India demonstrates that lead education can be highly cost effective. The National Referral Center for Lead Poisoning in India (NRCLPI) with the help and assistance from the Quality Council of India (QCI) has successfully initiated and launched the Lead Educators program (Lead-er) in ten states of India training over 6,000 school teachers on awareness about the impact of lead on our environment and health. Each of these school-teachers who had participated in a one day workshop could reach out to over 500 school students within six months. This has resulted in reduced exposure to lead and lead based materials. (Venkatesh, 2008). The next cheapest option is likely to be to support the priority of the Copenhagen Initiative in providing nutritional supplements (Vitamin C and trace minerals) to the poorest individuals. In particular, individuals who are iron and calcium deficient are far more susceptible to lead exposure, so the provision of these supplements to deficient individuals immediately reduces risk at minimal cost. Community studies in India showed that children who were anaemic, when provided with iron supplements, were found to have lower blood lead levels after exposure to environmental lead (Herman et al, 2003, Vishwanath et al, 1988) Both measures also have the advantage of being useful even if climate change does not occur (unlikely but possible). Both can be accomplished by private means if governments are disinterested. The more contraception programs are successful, the greater the proportion of aged in the population. It is strongly recommended that research be conducted into the tertiary prevention of lead poisoning. Since lead poisoning health effects are worsened by higher temperatures, and lead stored in bone returns into the blood during ageing, finding a treatment which can remove lead (and other toxic heavy metals) before the lead causes widespread health issues, will reduce the burden of ageing populations with lead induced slow reaction times, poor memory and hearing, balance problems, increased irritability, osteoporosis and mental decline. Conclusions This paper has identified relationships and correlations between climate change and lead poisoning, giving researched examples of each of the gain/loss combinations. Exposure to lead and occurrences of poisoning will be increased by climate change and also by efforts to mitigate climate change unless mitigation strategies are considered for gain/loss with other health and environmental issues. Priority strategies to counter global warming and climate variability need to overcome the scenarios in the LossèLoss quadrant and be selected from the GainèGain quadrant in their relationship with lead toxicity.
* Researcher, Global Lead Advice and Support Service (GLASS), run by The LEAD Group, Sydney Australia ** Manager, GLASS; President / Co-Founder (1991), The LEAD Group - aiming to achieve global elimination of lead poisoning and protection of the environment from lead. *** Volunteer Systems Analyst, GLASS **** Lead Man of India, Director, National Referral Center for Lead Poisoning in India (NRCLPI); Advisor, Quality Council of India; Professor, Department of Biochemistry & Biophysics, St Johns National Academy of Health Sciences PDF of this file Lead Climate Change Speech |
|||||||||||||||||||
|
About
Us |
bell
system lead poisoning |
Contact Us
| Council
LEAD Project | egroups | Library
- Fact Sheets | Home
Page | Media Releases |
|||||||||||||||||||
|
Last Updated 21 August 2014
|
|||||||||||||||||||


 Immediate
reduction in the construction of coal-fired power plants would have
immediate positive health benefits (including significant reductions in
lead emissions) but would have little short-term climate change impact as
the SO2 and brown haze resulting from coal combustion significantly
counteracts the global warming impact: contrary to popular imagination
coal combustion is only a major climate change driver if it is
comparatively “clean”. Converting to nuclear would eventually
eliminate lead and other emissions from coal fired power stations but at
the (remote) risk of a nuclear disaster spreading radioactive lead if it
occurred at a lead cooled reactor and the fate of lead used for radiation
shielding at all nuclear power plants. There remains considerable concern
of over the storage and security of fuel and waste even if the total
volume is low. Given nuclear power station take between 7 and 15 years to
construct any impact from shifting from coal to nuclear would be far too
late to influence greenhouse gas levels by 2020 though such
transformations may have a role to play in the 2020-2050 period once the
GEN IV reactors can be evaluated.
Immediate
reduction in the construction of coal-fired power plants would have
immediate positive health benefits (including significant reductions in
lead emissions) but would have little short-term climate change impact as
the SO2 and brown haze resulting from coal combustion significantly
counteracts the global warming impact: contrary to popular imagination
coal combustion is only a major climate change driver if it is
comparatively “clean”. Converting to nuclear would eventually
eliminate lead and other emissions from coal fired power stations but at
the (remote) risk of a nuclear disaster spreading radioactive lead if it
occurred at a lead cooled reactor and the fate of lead used for radiation
shielding at all nuclear power plants. There remains considerable concern
of over the storage and security of fuel and waste even if the total
volume is low. Given nuclear power station take between 7 and 15 years to
construct any impact from shifting from coal to nuclear would be far too
late to influence greenhouse gas levels by 2020 though such
transformations may have a role to play in the 2020-2050 period once the
GEN IV reactors can be evaluated.